Understanding gold trading volume is essential for anyone interested in the financial markets. It represents the value or number of trades executed across various venues, including physical, OTC, futures, and exchange-traded platforms. As of August 21, 2026, the market has seen a staggering $931.90 billion in trades.
The London OTC market, US futures market, and Shanghai Gold Exchange account for over 90% of global activity. Notably, the London OTC alone represents approximately 70% of this volume. This concentration highlights the significance of these markets in determining overall market trends.
Analyzing trading volume offers insights into market participation, liquidity, and changing investor behavior. It is crucial to differentiate between notional dollar value and the physical number of ounces traded. This distinction helps prevent misconceptions about trading metrics.
Understanding Gold Trading Volume Mechanics
Grasping the mechanics behind gold trading volume is crucial for market participants. This trading encompasses various activities, including spot transactions, forwards, swaps, options, and lease-loan deposits. Each type of contract provides unique exposure to market movements.
The CME Group’s COMEX operates primarily with the active-month contract, which serves as a proxy for the spot price. Despite limited physical delivery, this connection is vital for understanding market behavior. The Exchange for Physical market ensures that derivatives remain linked to actual bullion prices.
Moreover, liquidity plays a significant role in trading volume. A larger number of trades can narrow spreads and enhance execution quality. However, it is essential to note that high volume does not always equate to deep liquidity, especially when activity is concentrated among a few contracts or participants.
| Contract Type | Description | Liquidity Level |
|---|---|---|
| Spot | Immediate exchange of bullion | High |
| Forwards | Agreements to buy/sell at a future date | Medium |
| Options | Contracts giving the right to buy/sell | Medium |
| Futures | Standardized contracts for future delivery | High |
Global Market Centres and Their Impact on Trading Activity
The dynamics of global market centers significantly shape trading activity. These hubs, particularly London, the US, and Shanghai, are crucial in determining how precious metals are traded worldwide.
London OTC: This market commands approximately 70% of global notional trading volume. London sets the twice-daily LBMA Gold Price benchmark, influencing prices across major markets. The city’s time-zone advantage connects Asian and US trading sessions, making it a pivotal player in the global market.
US Futures Market: The CME Group’s COMEX is essential for price discovery. Its active-month contract links closely to spot prices, especially during Asian market hours, showcasing the growing influence of this market.
Emerging Influence of the Shanghai Gold Exchange: Established in 2002, the SGE is the largest purely physical spot exchange. Its introduction of the Shanghai Gold Price benchmark in 2016 reflects its expanding role in global trading.
Gold Trading Volume Trends in Global Markets
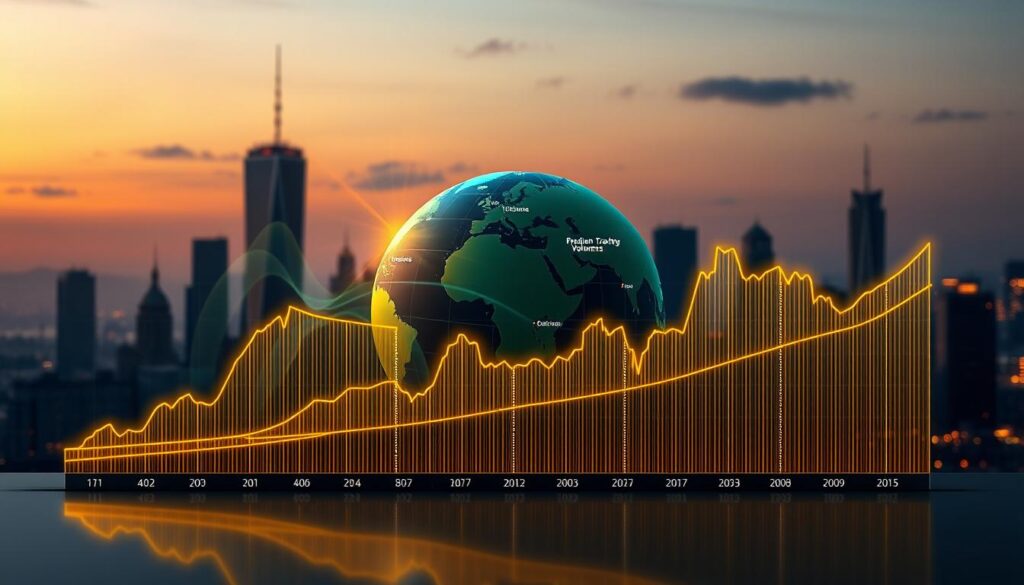
Recent trends in trading activity reveal significant shifts in market dynamics. The latest data shows that gold trades reached a remarkable $931.90 billion in the 12-week moving average for the period ending August 21, 2026. In comparison, silver recorded $144.65 billion, while platinum and palladium stood at $15.28 billion and $7.03 billion, respectively.
The LBMA Trade Data, owned by LBMA and licensed by Nasdaq, enhances transparency in the global OTC precious metals market. This data includes daily T+1 reporting and weekly summaries, allowing for better comparisons between exchanges. Understanding these reporting schedules is crucial for market participants.
Moreover, estimates indicate that non-LBMA OTC activity ranges from 2.5% to 7.5% of reported LBMA volume starting March 2024, with a midpoint of 5%. Historical comparisons show non-LBMA activity at 5% to 15% from November 2018 to February 2024, with 10% as the midpoint.
| Metal | 12-Week Trading Volume | Percentage of Total |
|---|---|---|
| Gold | $931.90 billion | 86.6% |
| Silver | $144.65 billion | 13.4% |
| Platinum | $15.28 billion | 1.4% |
| Palladium | $7.03 billion | 0.6% |
Interpreting Trading Data: Liquidity, Investor Sentiment, and Market Growth

The analysis of trading data reveals critical insights into market behavior and investor sentiment. Understanding how liquidity impacts the attractiveness of assets is essential, especially during market stress. Investors often turn to liquid assets that can be traded across various global venues.
Rising trading volumes can indicate stronger demand and broader market participation. However, it is crucial to interpret this data carefully. For instance, the 12-week moving average trade value for the period ending August 21, 2026, shows a substantial $931.90 billion in activity. In contrast, silver’s $144.65 billion provides context within the broader precious metals landscape.
Before making investment decisions, analysts should combine trading volume with other factors like price direction, spreads, and ETF flows. This comprehensive approach helps distinguish genuine demand growth from nominal dollar increases due to rising prices or contract values.
| Asset | 12-Week Trading Volume | Market Activity |
|---|---|---|
| Gold | $931.90 billion | High |
| Silver | $144.65 billion | Medium |
| Platinum | $15.28 billion | Low |
| Palladium | $7.03 billion | Very Low |
Final Reflections on Market Dynamics and Future Outlook
The interconnectedness of major market centers is vital for comprehending the global landscape of precious metals. London, with its significant share, plays a pivotal role in price setting. Meanwhile, COMEX facilitates price discovery, and the Shanghai Gold Exchange showcases the importance of physical market transactions.
The remarkable $931.90 billion recorded recently serves as a benchmark but does not fully encapsulate market sentiment or future pricing trends. Analysts must consider reporting differences and the nuances of various exchanges to gain a clearer picture.
Looking ahead, it is essential to evaluate a mix of indicators, including OTC, futures, and physical markets. This comprehensive approach will provide deeper insights into liquidity and investor confidence, reinforcing gold’s position as a vital asset in global portfolios.